Quick Start Guide to Infrastructure Monitoring with Nagios
Staying ahead of IT service issues can be frustrating when you manage several servers, or even a single server with many services. Enterprise IT Infrastructure Monitoring Solutions (a fancy term for something that is really pretty simple) attempt to remedy the problem by repeatedly checking the status of machines and services on the network and alerting the responsible administrators as soon as something goes wrong, or even before there’s a problem.
It’s hard to argue against implementing a monitoring solution within the network, as it is much a setup-and-forget matter that adds negligible load. The monitoring solution itself is — or at least, should be — very low maintenance, yet provides very valuable insight into the health of the network.
Introducing Nagios
![]() Nagios is an infrastructure monitoring solution that is both popular and open source. Apart from its obvious monitoring capabilities, it includes the ability to associate an event handler to an event, allowing you to fix a problem automatically. If — for example — one of your Python applications crashes, you can have Nagios do
Nagios is an infrastructure monitoring solution that is both popular and open source. Apart from its obvious monitoring capabilities, it includes the ability to associate an event handler to an event, allowing you to fix a problem automatically. If — for example — one of your Python applications crashes, you can have Nagios do python /opt/myapp/myapp.py automatically, before any human administrators have the time to do so. Other features include the ability to create many kinds of reports, and to send notifications and alerts via email and SMS.

Nagios is based primarily on C and shell scripts, which makes it light on performance but adds a slightly ‘hackish’ feel. It comes with a CGI-based web interface (which we’ll spice up a bit) that lets you view and manage Nagios, through what are known as External Commands.
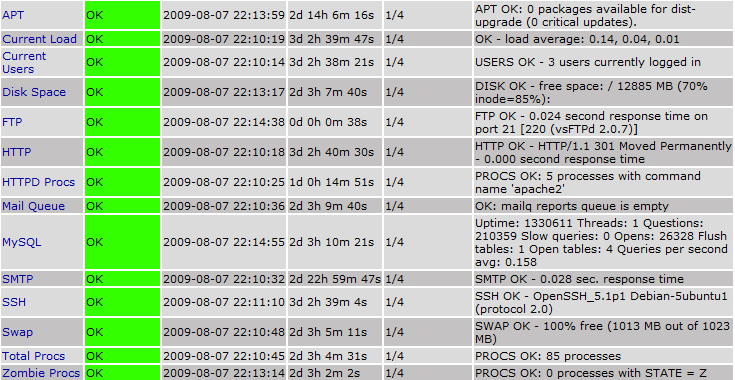
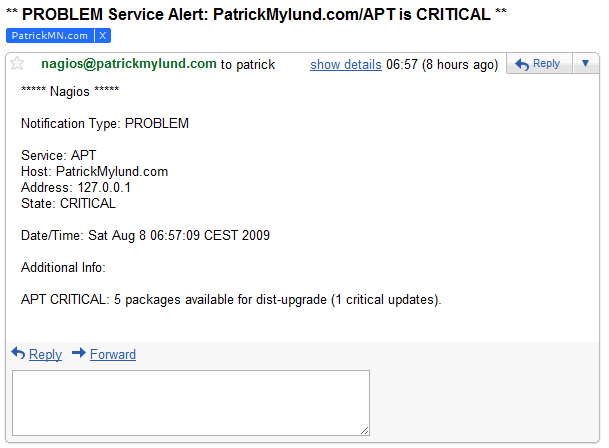
I’d like to demonstrate how to set up rudimentary Nagios monitoring on a small farm of Linux servers, with an Ubuntu/Debian server running the primary Nagios process. In the end, we’ll be monitoring the states of various services on the servers, including the ones seen in the screenshot above (Apache processes, APT, Current Load, Current Users, Disk Space, Dovecot, FTP, HTTP, MySQL, SMTP, SSH, Swap, Total Processes, and Zombie Processes). We will also receive notifications by email whenever something goes wrong:

Please note that this guide is meant to get you up and running quickly, and that it’s not a substitute for the official Nagios documentation. If you want to know what all of the different configuration options do (or can do), please consult the (excellent) documentation.
Setting Up The Nagios Server
The steps in this section should just be done on the main Nagios server, not the clients it will be monitoring. We’ll get to those later!
This procedure should be quite similar on other distributions if you use their package managers (yum, yast, urpmi, etc.) or install Nagios from source, but no guarantees.
-
Let’s become root so we don’t have to prepend
sudoto everything:sudo -s
-
If you want to make use of Nagios’ web interface and Apache isn’t already installed:
apt-get install apache2
It’s entirely possible to use something like nginx or lighttpd to serve the interface, but that is not covered in this guide. -
Install Nagios from the package repositories:
apt-get install nagios3 nagios-nrpe-plugin
-
Stop Nagios:
/etc/init.d/nagios3 stop
-
Add a new user for the web interface, e.g. patrick. The default configuration grants all security permissions to the user nagiosadmin, but we’ll change that to the name of the new user, too:
htpasswd -c /etc/nagios3/htpasswd.users patrick
perl -p -i -e "s/nagiosadmin/patrick/g" /etc/nagios3/cgi.cfg
-
If you want to add more user accounts for the web interface:
htpasswd /etc/nagios3/htpasswd.users john
-
And if you want to give them superuser privileges:
perl -p -i -e "s/patrick/patrick, john/g" /etc/nagios3/cgi.cfg
Go through/etc/nagios3/cgi.cfgmanually to see what the different security options do, and to grant more fine-grained privileges to other administrators. -
Edit
/etc/nagios3/nagios.cfgand changecheck_external_commands=0to1to allow monitoring commands to be issued through the web interface -
On Debian/Ubuntu, run the following commands after setting
check_external_commands=1:dpkg-statoverride --update --add nagios www-data 2710 /var/lib/nagios3/rw dpkg-statoverride --update --add nagios nagios 751 /var/lib/nagios3
-
Edit
/etc/nagios3/conf.d/contacts_nagios2.cfgto match your preferences. Example:define contact{ contact_name patrick alias Patrick Mylund service_notification_period 24x7 host_notification_period 24x7 service_notification_options w,u,c,r host_notification_options d,r service_notification_commands notify-service-by-email host_notification_commands notify-host-by-email email [email protected] }And further down:define contactgroup{ contactgroup_name admins alias Nagios Administrators members patrick } -
Make a host definition for a server you want to monitor by creating a matching config file, e.g for the server ‘tranquillity’,
nano -w /etc/nagios3/conf.d/tranquillity_nagios2.cfg, then insert a declaration. Example:define host{ use generic-host ; Name of host template to use host_name tranquillity alias PatrickMylund.com Web Server address 209.20.82.6 }You can put all of your host definitions in one file if you want, e.g.datacenter1_nagios2.cfg— just remember the_nagios2.cfgat the end of the file name, which is what tells Nagios to load that file (and in the proper format). - Repeat the step above to add a host definition for each server you want to monitor
-
Move some standard configs to make room for our configured ones:
mv /etc/nagios3/conf.d/localhost_nagios2.cfg /etc/nagios3/conf.d/localhost_nagios2.cfg.old
mv /etc/nagios3/conf.d/services_nagios2.cfg /etc/nagios3/conf.d/services_nagios2.cfg.old
wget https://cdn.pmylund.com/files/misc/1202-nagios_quickstart/services_nagios2.cfg -O /etc/nagios3/conf.d/services_nagios2.cfg
-
Edit
/etc/nagios3/conf.d/hostgroups_nagios2.cfg. List which hosts (comma-separated) should belong to which groups (debian-servers,http-servers,ssh-servers, andping-servers), and add some extra hostgroups:db-server,ftp-servers, andmail-servers:define hostgroup { hostgroup_name db-servers alias Database servers members tranquillity, singularity } define hostgroup { hostgroup_name ftp-servers alias FTP servers members tranquillity, singularity } define hostgroup { hostgroup_name mail-servers alias IMAPS/SMTP servers members tranquillity }You can see which services are associated with which hostgroups by looking in/etc/nagios3/conf.d/services_nagios2.cfg.
Nagios should be accessible at http://nameofnagiosserver/nagios3 already! We still have some configuration to do, though.
The perl command above replaces all occurrences of nagiosadmin with patrick in the file /etc/nagios3/cgi.cfg.
The users listed in /etc/nagios3/cgi.cfg are effectively global administrators. For regular users, you can still add them as users with htpasswd, but assign privileges by making them Contacts for certain hosts or hostgroups, instead. We’ll get to this later!
We’re done with the Nagios server for now. Let’s look at the settings for the Linux servers we want to monitor.
Configuring Monitored Clients
The steps in this section should be done on each Linux host that you want to monitor.
-
Again, let’s become root:
sudo -s
-
Install Nagios’ NRPE module:
apt-get install nagios-nrpe-server
Installing the NRPE module is optional, but you won’t be able to run any of Nagios’ scripts directly on the target client if you do not. This is necessary for monitoring system stats, and generally anything that cannot be probed from the outside over the network (by the main Nagios server).
See the NRPE documentation (PDF) for manual installation instructions, as well as how to get information via SSH (get_by_ssh) instead of NRPE. -
Stop NRPE:
/etc/init.d/nagios-nrpe-server stop
-
Install a custom nrpe_local.cfg (this will save us some time later):
mv /etc/nagios/nrpe_local.cfg /etc/nagios/nrpe_local.cfg.old
wget https://cdn.pmylund.com/files/misc/1202-nagios_quickstart/nrpe_local.cfg -O /etc/nagios/nrpe_local.cfg
Go through
On the main Nagios server, all service commands prefixed with/etc/nagios/nrpe_local.cfgto see the list of commands that Nagios will be able to execute on hosts running NRPE. By default, NRPE will only run the commands defined in this configuration file, and without any arbitrary arguments. I strongly recommend you stick to this for security purposes.check_nrpe_1argin/etc/nagios3/services_nagios2.cfgare commands defined in/etc/nagios/nrpe_local.cfgon the monitored clients. -
Define what hosts are going to be allowed to probe the NRPE module for information (comma-separated). For instance, if the main Nagios server has IP 192.168.1.105:
perl -p -i -e "s/127.0.0.1/192.168.1.105/g" /etc/nagios/nrpe_local.cfg
-
If you have a firewall (
iptables,ufw, etc.), you need to open for connections on port 5666 on the clients (for NRPE). If the main Nagios server has IP 192.168.1.105, you could doufw allow proto tcp from 192.168.1.105 to any port 5666, orufw allow 5666/tcpwith Ubuntu’s Uncomplicated Firewall. -
Start the NRPE module:
/etc/init.d/nagios-nrpe-server start
We just about have a basic Nagios setup now!
Testing Nagios
Let’s see if what we’ve set up is working. On the main Nagios server, start the Nagios service:/etc/init.d/nagios3 start
If all goes well, navigate to e.g. http://192.168.1.105, login with the user credentials you set up earlier, then click on Service Detail in the menu on the left. All of our services will be PENDING, meaning they’ll be checked shortly. You can speed this up by clicking on a service and clicking Re-schedule the next check of this service (this is what is called an External Command).
If any of the service states turn out to be CRITICAL or UNKNOWN, don’t panic — take a look at the different configuration files in /etc/nagios3/conf.d. The settings and commands are pretty straight-forward.
You can find examples of the resulting configuration files in nagios-conf-example.tar.gz. The configs are for a single server (singularity) with the IP address 192.168.2.3.
An Extra Touch
Nagios’ web interface doesn’t look very pretty. We can spice it up a little by changing the CSS. I’ve prepared a modified status.css for your convenience:
mv /etc/nagios3/stylesheets/status.css /etc/nagios3/stylesheets/status.css.old
wget https://cdn.pmylund.com/files/misc/1202-nagios_quickstart/status.css -O /etc/nagios3/stylesheets/status.css
Now hit F5 in the web interface!
Bear In Mind
- The easiest way to monitor the Nagios server itself is to pretend it’s yet another server. Install NRPE, set the connection settings, and add it in the host declarations with the other servers.
-
The exclamation mark (!) is meant to separate command arguments in Nagios configuration files. For instance,
check_nrpe_1arg!check_swapwould mean you’re runningcheck_nrpe_1argwith the argumentcheck_swap. -
All of the scripts and commands you can issue through Nagios are stand-alone scripts. When configuring Nagios, you can run each command, for instance
check_smtp, manually instead of doing tons of trial-and-error with the configuration files:/usr/lib/nagios/plugins/check_smtp -H 192.168.1.105 /usr/lib/nagios/plugins/check_smtp -h
- All lists in Nagios configuration files are comma-separated.
-
You can set the
Example:contact_groupsvalue on any service, host, or hostgroup declaration. Contact groups are defined in/etc/nagios3/conf.d/contacts_nagios2.cfg. Any person in a contact group that has a user account for the web interface (htpasswd.users) can automatically view any hosts and services associated with it.define hostgroup { hostgroup_name mail-servers alias IMAPS/SMTP servers members singularity contact_groups mailadmins }
Again, the best part about what we’ve set up now is that you can go right ahead and forget about it. You’ll receive an e-mail at the contact address specified whenever something is amiss, as well as when it gets better. If I’m right, though, you’ll want to tune your configuration a lot further. We’ve barely touched the surface; Nagios can do much more, and everything is thoroughly documented in the official documentation.
Other useful links: